QC Analysis
Statistical control with alerts before limits are breached.
QC plans with acceptance criteria and trend alerts built in — your QC data watches itself and flags shifts before limits are breached.
A QC Failure Caught at Review Time Was Reported for a Week.
QC data captured on paper or in an analyzer silo gets reviewed in batches — daily if the lab is disciplined, weekly if it is busy. A shift or trend that a rule would have caught on Tuesday surfaces at Friday review, after four days of patient results went out on an assay drifting out of control.
The downstream cost is the lookback: which results, which patients, which clinicians to notify. CLIA calls this corrective action; the lab calls it the worst week of the quarter.
What CLIA, CAP, and ISO 15189 Require From Quality Control
CLIA 493.1256 requires control procedures that detect immediate errors and monitor accuracy and precision over time. CAP requires documented QC review at defined intervals, with corrective action for failures — before patient results are released. ISO 15189 adds trend detection and the use of statistical techniques to monitor performance.
Paper QC logs technically comply and practically fail — rules are applied by eye, trends emerge at review, and the record of what a tech decided at 6 a.m. is a checkmark. Kintavo applies the rules at entry, blocks release on failure, and signs every decision.
Component QC the Way FDA Describes It — Statistically Valid, Not Just Documented
For leukocytes reduced Whole Blood, Red Blood Cells, Plasma, and Platelets, conformance to product standards must be assessed by a statistically valid method under 21 CFR 211.160(b). FDA's pre-storage leukocyte reduction guidance is explicit about what that means: in the absence of a manufacturer's plan, a plan built on 95% confidence that more than 95% of components meet the standard — and FDA will consider plans confirming a < 5% non-conformance rate at that confidence.
Kintavo builds the plan as a record: distribution, window, sample size, allowed failures, and confidence/conformance level are configured up front and locked — because the guidance is equally explicit that sample sizes are pre-determined and fixed. If you plan 94 and see no failures in the first 60, dropping to 60 is not permitted. The system will not let the plan move under you mid-window.
Per FDA's September 2012 pre-storage leukocyte reduction guidance, or the device manufacturer's specifications where different. Pooled platelet doses carry < 5.0 × 10⁶ residual WBCs across the pool. Platelets, Pheresis are governed by FDA's separate Collection of Platelets by Automated Methods guidance; configure those plans against it.
The old way, retired.
This is the actual screen.
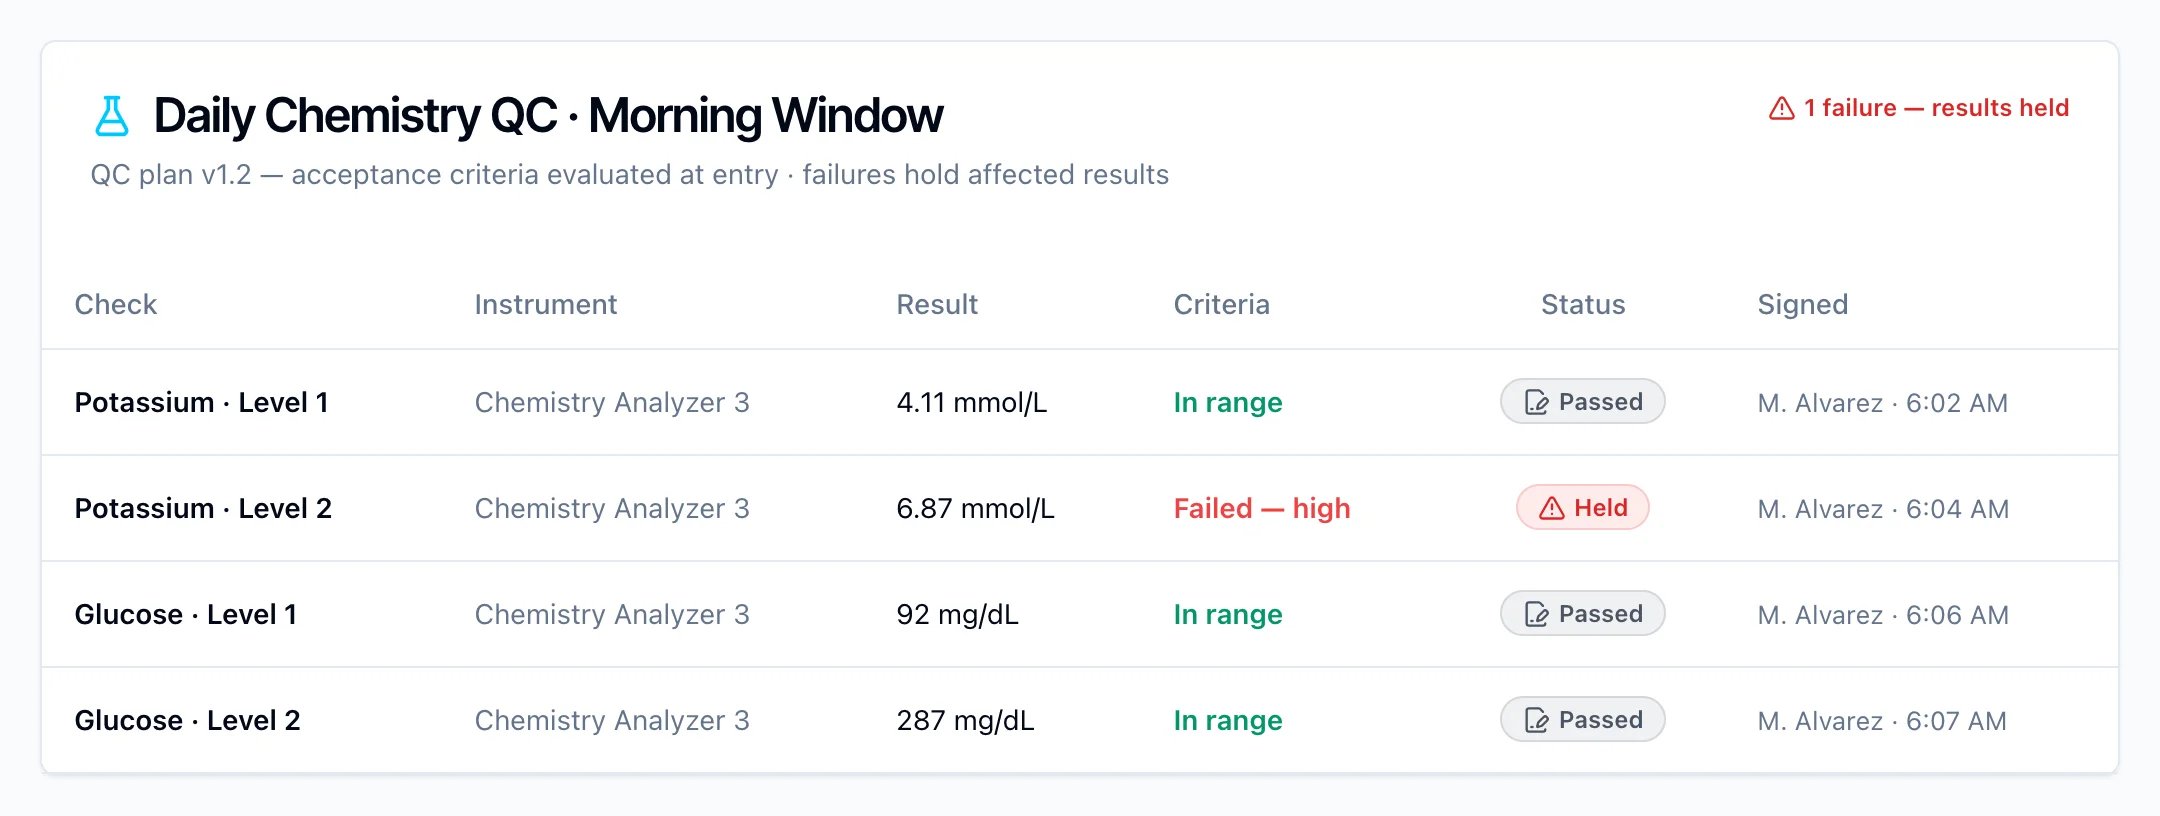
Criteria at Entry. Not at Review.
A Tuesday-morning control value fails its acceptance criteria on potassium. The tech sees the flag at entry — patient results hold for the analyte. The corrective record documents the cause (a failing electrode), the repeat runs, and the supervisor release. The lookback query is never needed, because nothing left the lab on a failed run. Friday review is exceptions only: forty analytes, three minutes.
In a blood center, the August window on leukocytes reduced Red Blood Cells runs a binomial plan: 60 samples, zero process failures allowed, 95%/95%. Two units fail residual WBC. One investigation finds sickle cell trait — classified non-process, excluded from the denominator, replacement required, and the donor record flagged so the next donation is diverted. The other is a filter defect: a process failure, and with zero allowed the window fails to a documented investigation rather than a quiet pass. Neither result posts until both classifications are signed.
Part of one connected system.
QC Analysis shares the same data model, AI engine, and audit trail as the other eighteen modules — so its records see, and are seen by, everything else in your quality system.
QC Analysis FAQ
How are QC acceptance criteria defined?
Per QC plan: your team defines the checks, frequencies, and acceptance criteria per analyte or process — including risk-based (IQCP) designs — and the platform evaluates them at entry.
Can QC values come directly from our instruments?
Values enter from the bench on a tablet or via API integration — either way through the same acceptance-criteria evaluation, so the evidence standard is identical.
What happens when a run fails?
The failure flags immediately, affected results hold, and a classified failure record opens: cause, action, repeats, and a signed release decision. Review meetings become exception reviews.
How are new control lots handled?
Parallel testing establishes lot-specific ranges before the lot goes live — the same quarantine-to-release discipline Kintavo applies to inventory.
Does Kintavo support binomial and hypergeometric sampling plans?
Both. Configure the distribution, window, sample size, allowed failures, and confidence/conformance level per plan — 95%/95% for residual WBC and pH, 95%/75% for platelet yield under 21 CFR 640.24(c). Hypergeometric plans are for monthly QC monitoring; the guidance does not permit them for validation.
How are non-process failures excluded from the statistics?
By signed classification. A failure investigated to a donor-specific cause such as HbS is classified non-process, leaves the denominator, and raises a replacement requirement. Until every failure in a window is classified, the plan stays at Pending Classification and reports no final status.
Can the sample size change once a window is open?
No — and that is deliberate. FDA states sample sizes are pre-determined and fixed: planning 94 and dropping to 60 after a clean first 60 is not permitted. Plan parameters lock at activation, and any change is a new plan with its own record.