Configurable Dashboard
Your compliance picture. Real-time. All in one view.
Role-based dashboards your team assembles themselves — open CAPAs, overdue training, calibration windows, audit countdowns.
Status Meetings Exist Because Nobody Can See Status.
The Monday quality meeting spends its first half reconstructing reality: who pulls the overdue training list, who checked the calibration schedule, whose spreadsheet is current. Every module has a status; no one has the picture. So the picture gets assembled weekly, by hand — and is wrong by Wednesday.
The compliance cost is the lag. An overdue competency or a lapsed supplier is invisible for days at a time — precisely the window in which it becomes an inspection finding instead of a task.
Oversight Is a Requirement, Not a Meeting
Every framework demands management oversight with data behind it: ISO 13485 clause 5.6 requires management review with defined inputs — audit results, monitoring, corrective actions. CLIA holds the lab director responsible for overall operation. ICH Q10 expects management to review quality metrics and act on them.
A dashboard is only oversight if it is true. Kintavo’s numbers are computed live from the records themselves — the same records inspectors audit — so what leadership sees and what the system contains are never two different things.
The old way, retired.
This is the actual screen.
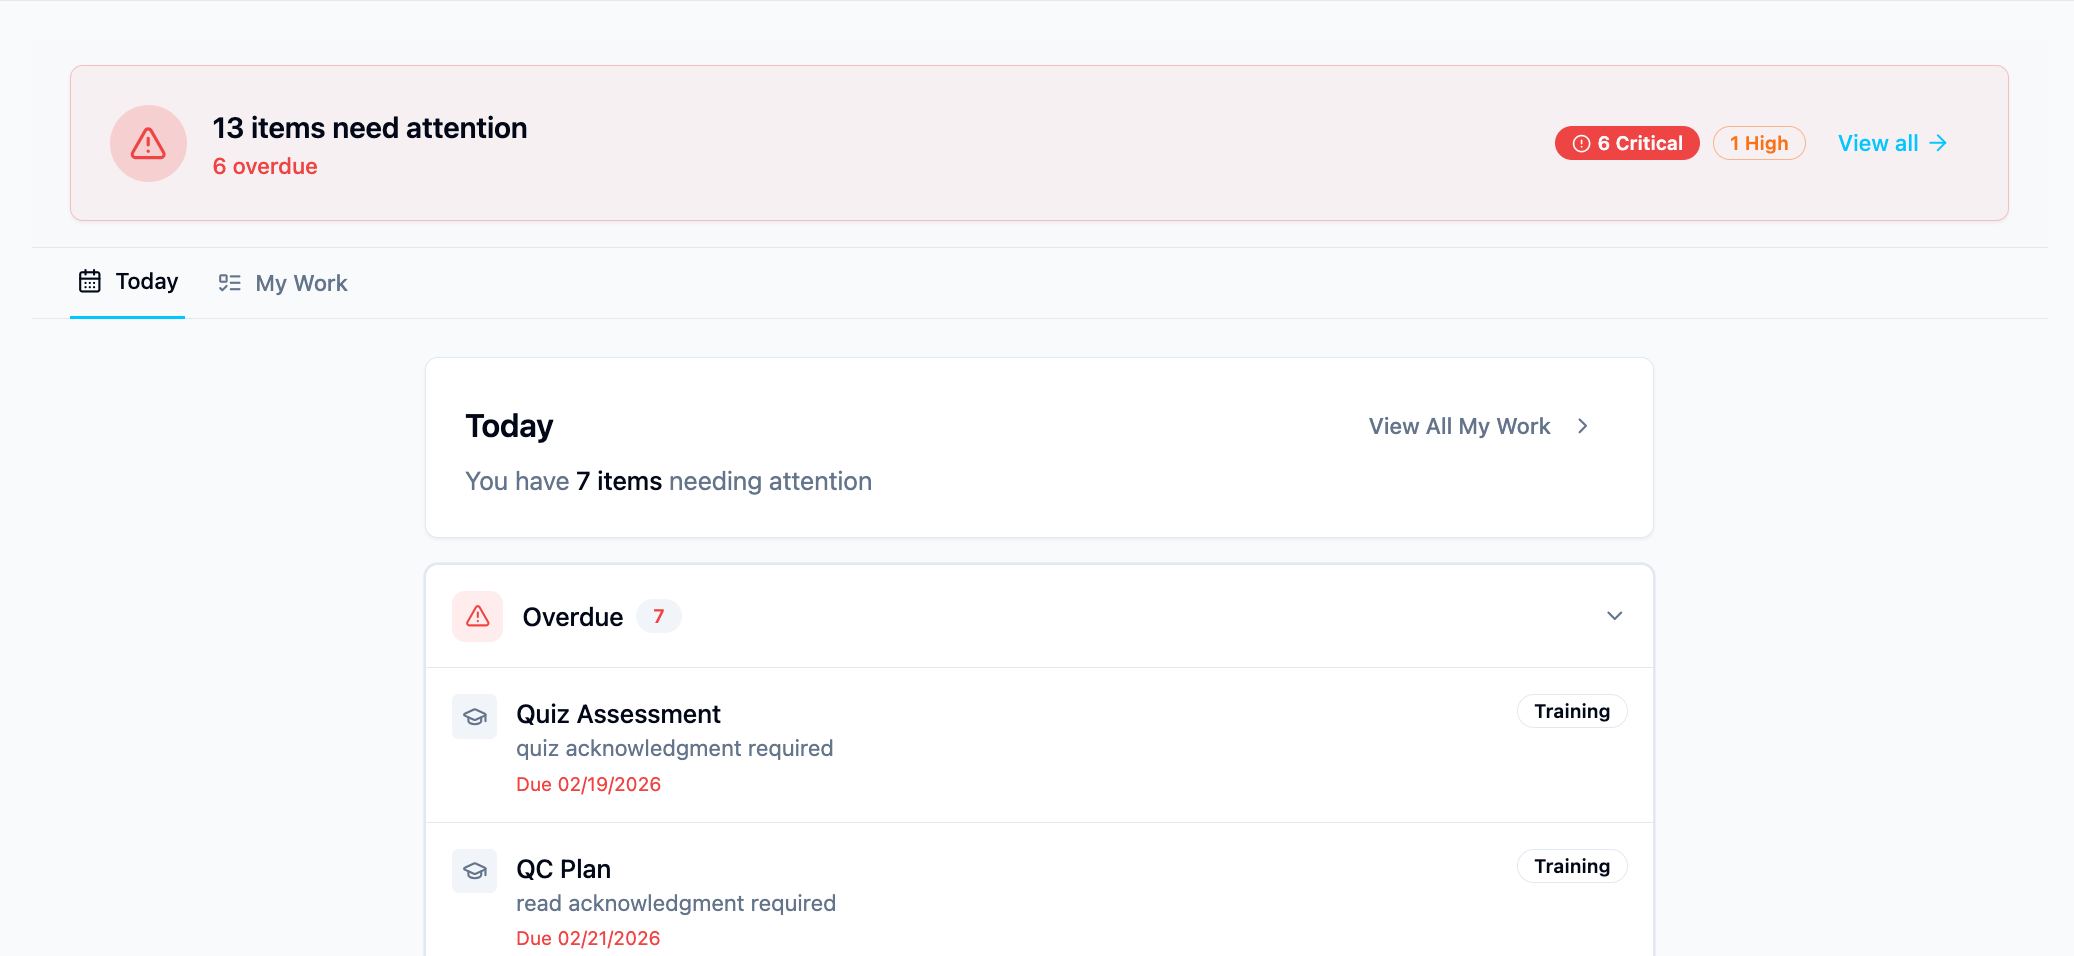
Computed From the Records. Configured to the Role.
The lab director’s Tuesday starts with the network view: two sites green, one showing six critical items — four overdue competencies and two QC failures pending review. She drills into the site, assigns the competency escalation to the section supervisor from the dashboard, and is done in four minutes. At Friday’s management review, the same numbers — because there is only one set.
Part of one connected system.
Configurable Dashboard shares the same data model, AI engine, and audit trail as the other eighteen modules — so its records see, and are seen by, everything else in your quality system.
Configurable Dashboard FAQ
Are dashboard numbers real-time?
Yes — computed from the records themselves at view time, not from scheduled reports. What the dashboard says and what the system contains cannot disagree.
Can different roles see different dashboards?
Yes. Views are role-based: bench staff see their queue, supervisors their section, directors the site or network — configured in the dashboard builder by your team.
Can we build our own widgets and KPIs?
Yes — the widget library covers KPIs, queues, trends, and module summaries, arranged per role without IT involvement. Custom metrics draw on any module’s data.
Does the dashboard support multiple sites?
Yes — site, region, and network rollups with drill-down preserved to the individual record at every level.